About this comprehensive plan...
Since it has been discussed so much lately I wanted to dig into this comprehensive plan for the city, Imagine IF. My professional background and expertise is in human-centered design, human performance, and the general risk associated with human actions in complex systems. Due to that background I am always very interested in ensuring that policies or processes are human-centered, focused on feedback from users, and designed with the reality of human cognition in mind. Full disclosure, I do run a consulting agency focused on human-centered civic design, Civix Design and would love to work more with our local government entities to avoid the issues I found here. Hire me!
Now how does that link to something like a city's comprehensive planning document? I'll admit I do not have expertise in most of the substantive discussion here, in terms of planning principles and insights. However, I am fairly good at spotting wackiness in surveys or user engagement methodologies so I figured I'd explore how the human-centered side of this process unfolded. I'm hoping this post is part analysis and part education. We can always use more skepticism and clarity on surveys.
Now one thing that I need to be clear about, at no point in my review did I feel like there was any malicious or sneaky actions taken by the drafters or the staff engaged. It is incredibly common, and frequently the case, that survey drafters or people trying to engage with users are coming from the right place. Often they have an idea how to fix some problem. They believe in their solution and want to ensure that you do too. This is a very different than the manipulative way some surveys, mainly political ones, leverage human psychology to affect our behavior. Looking at you, Frank Luntz. While I will be going into some problematic things I see in this plan's methodology they are common enough mistakes that I would expect some of my undergraduate or early graduate students in psychology to make. Does that undermine the report's strength? Yes, absolutely. Does it imply malfeasance or shenanigans? Absolutely not.
Methodology
The first thing I noticed in the city's description of their efforts is a very wide ranging list of engagement types, see Figure.
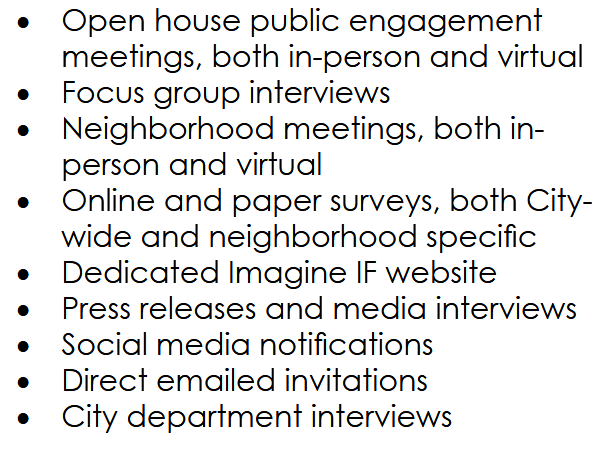
Initially this is great. You want to get user engagement in various contexts and environments to cross reference and get to something approaching Truth. However, many of these activities, if completed as part of a structured data collection effort, would require their own methodologies. These appear to not be present. For example, knowing how participants were selected for focus groups or who they were. Where and in what contexts were the neighborhood meetings? Were they spread across the city or in common areas? Direct emails, again who and how were they selected? All of these questions are critical to assessing if these were done correctly and therefore if the data collected is valid and useful. If those were real vectors for user engagement then we should ask for more information on each. If they were unable to achieve one, for example neighborhood meetings, that is fine but they should be clear. Basically, if you have it show it to me. If you don't tell me why you don't.
We do have more insight into the online survey that was distributed in the Appendix, so we will move to that next.
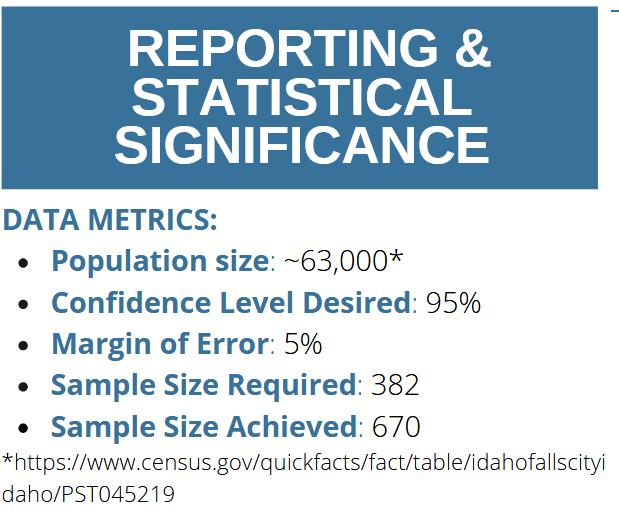
From a pure stats perspective this sample size should give us some solid insights that generally reflect the population of IF. However, you can't distribute a bad collection tool to a large enough sample and then decree you did it right. Your collection tool and method needs to be valid first. One thing I was super happy to see was a limitations section. Never trust anything that doesn't discuss what it couldn't do. See below:
None of these are necessarily fatal to the effort, but there is some cause for concern. Median household income in Idaho Falls is around $75k, so half earn more and half earn less. Of the less, 30% of Idaho Falls households are $50k or lower. So that's a sizable gap in the sample. Then we move to education. 90% or so of Idaho Falls citizens have a diploma. However, only 30% have a Bachelors degree or higher. Again that's a big gap. What this means is that this survey sample was overly slanted toward higher earners and higher education levels. Makes sense. Lower income or lower education populations are notoriously disengaged or unaware of these efforts. Upon discovering this kind of shortcoming in the sample, I would have liked to see the city more actively target specific areas and demographics to get a more well-rounded sample. It is my opinion that this is even more important because the poor or less educated are less likely to vote or engage in local politics, though they will often bear the brunt of governmental decisions simply because it costs money and time to navigate challenges.
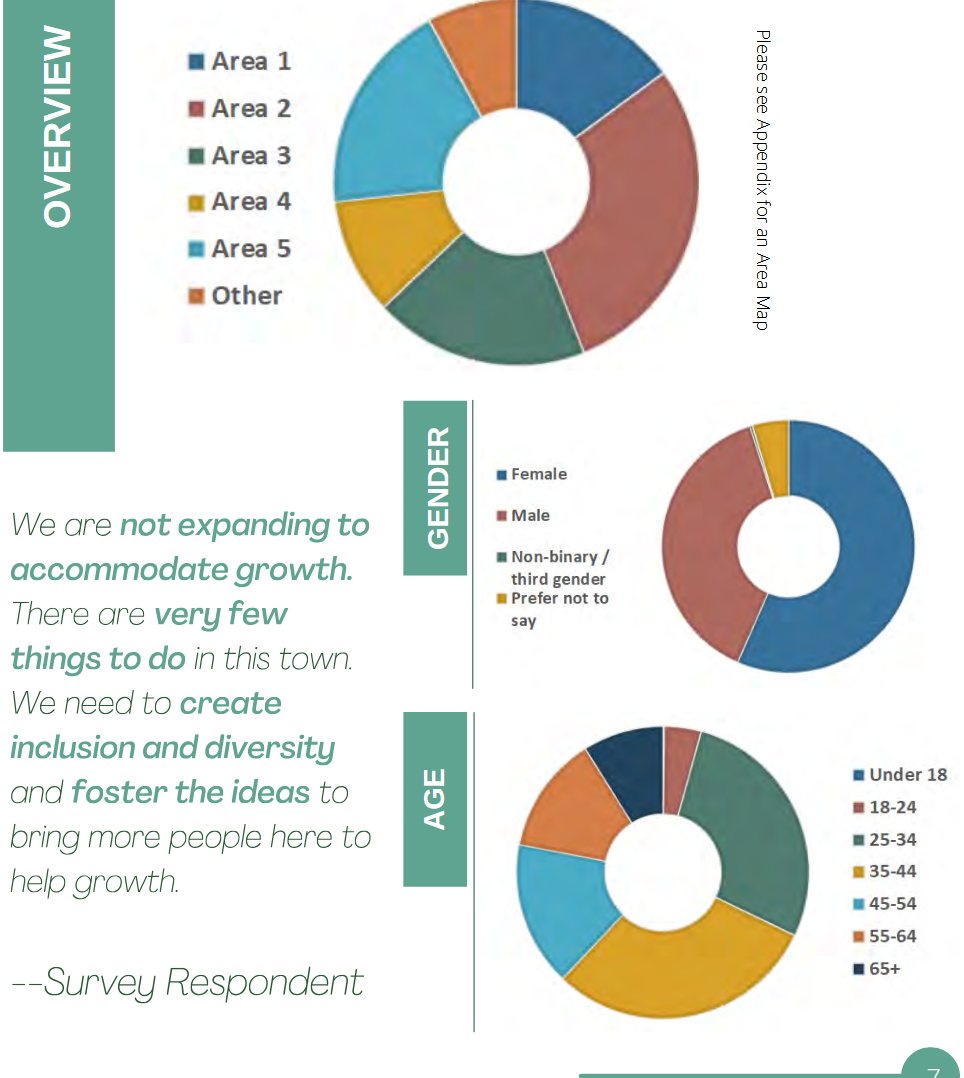
Alright, next I'm just going to pull a couple things out. On an educational note, stop using relative shape graphs. Just stop. Please, we are begging you. No more pie or donut charts. They are always the worst way to communicate the information you have.
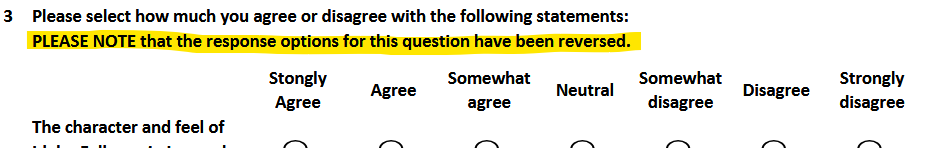
Here's another example of "don't do this." The order of the options are reversed from the previous question. Don't do this. At best its an annoyance, worst it is a poison pill for your data collection. Stop it.
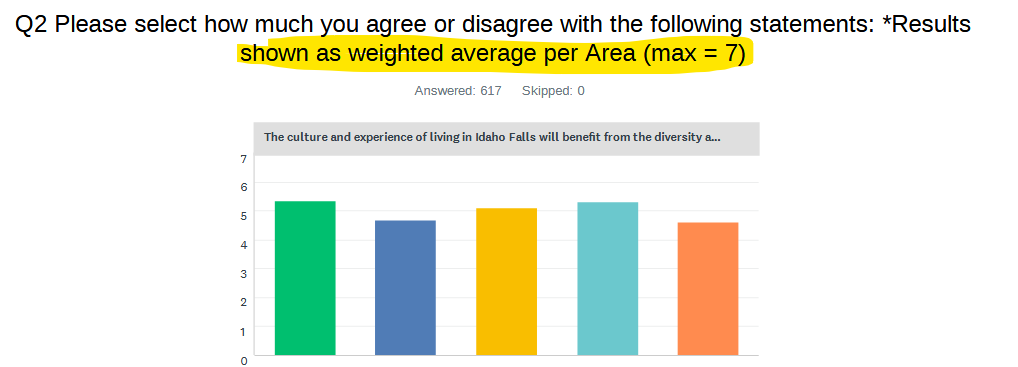
Alright, next we are going to look at some results and some issues I see. So, I legitimately do not know what this is saying. They converted the agree/disagree, also called Likert (pronounced lick-ert, I know its weird) scales to numbers. Which isn't that peculiar, however I don't think it was necessary. I'm not sure if these bars are supposed to be aggregation or some other function. It does say "weighted average" which.....okay..... But then what is the weighting factor? You often use weighting to ensure that an underrepresented or particularly important group is represented in a large sample. So, for example, if they weighted in favor of lower income and lower education levels then it might have helped mitigate their limitations. I just don't understand what they weighted by so I can't say anything one way or another about this data.
Okay, the full survey is available in the appendix but after the initial agree/disagree scales the survey asks respondents to rank the causes of challenges in securing housing in Idaho Falls. That is a very valuable question. You could use these rankings to cross other data points like demographics, regions, socioeconomic classes, and more to understand the three dimensional problem of housing in Idaho Falls. Instead of really digging into this, they did something peculiar. See below, they broke it down by individual item, e.g., cost, and then it seems like they aggregated the values and averaged them, again with some unknown weighting. This is odd because ranking questions can lose detail when you aggregate them directly. There are other, better, ways to represent that data, like a network graph, similarity matrices, or dendograms can be useful. But again, why and what are they weighting for? And weighting in general for ranking is not the right approach if there is a problem that weighting could solve. There are other tools for that.

Conclusion
I swear one of these posts will be a reasonable length one day, sorry about that. But my main takeaway is that this comprehensive plan, at least the public facing documents (maybe there is more detail under the hood), is not well researched in terms of user/stakeholder engagement. It is not even mildly rigorous and if city council relied on this data as it is represented here, then they should revisit their assumptions or thoughts. This is also why local government efforts are so important. They have the greatest impact on most people's lives. As such they should be done to a higher standard of rigor and validity, citizens deserve civic services that work for them. That was the motivation for me starting the business, I wanted to be able to help make government interactions better. This survey is an example of something we could help on.
Also to reiterate, I don't think any of this is indicative of shenanigans. The survey isn't written at a professional level but it isn't sneaky or manipulative at all. The issues I've noted here are common enough for people who don't do this regularly or have any education in these areas. People are complex and challenging to get information from in the best of cases. Survey design isn't rocket science but it does need to be done right to ensure that you have the best information possible. And I don't think the city got the best insights here.